Fil:Projected global primary electricity consumption by source, over the 21st century, for a climate change mitigation scenario.png

Fuld opløsning (1.508 × 850 billedpunkter, filstørrelse: 71 KB, MIME-type: image/png)
|
|
Denne fil er fra Wikimedia Commons. Beskrivelsen af filen fra Commons er gengivet nedenfor. |
Beskrivelse
| Beskrivelse |
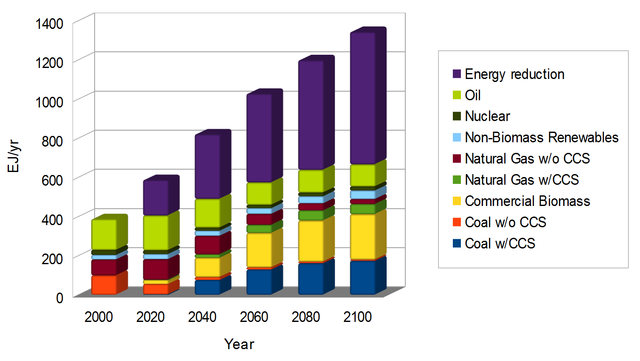
English: This graph shows a projection of global primary electricity consumption (PEC) by source, over the 21st century. It is based on a climate change mitigation scenario, in which anthropogenic (i.e., human) greenhouse gas emissions are substantially reduced over the century.
The graph shows how a variety of energy sources contribute to PEC. It also shows how energy consumption is reduced compared to a "reference scenario", in which no efforts are made to reduce greenhouse gas emissions. In the scenario, PEC increases over time, from 387 exajoules (EJ) in 2000, to 666 EJ in 2100. Energy savings contribute significantly to reductions in energy use compared to the reference scenario. In the reference scenario, PEC increases from 387 EJ in 2000 to 1344 EJ in 2100. The graph shows that fossil fuels dominate PEC in 2000. By 2060, most coal is used with carbon capture and storage (CCS), with a increase in the share of PEC supplied by commercial biomass. In 2100, the percentage contributions to PEC are: energy reductions 51; coal with CCS 13; coal without CCS 0.4; commercial biomass 17; natural gas with CCS 3.8; natural gas without CCS 1.9; non-biomass renewables 3.3; nuclear power 1.5; oil 8.4. Data Data for the mitigation scenario are summarized below. The full set of data are provided in a later section as comma-separated values (CSV). The data below summarizes PEC by source in EJ. Energy reductions in the mitigation scenario are equal to total PEC in the reference scenario minus total PEC in the mitigation scenario. Data are provided for the years 2000, 2050, and 2100, respectively:
The following data shows the percentage contribution of sources to total PEC. Data are provided for the years 2000, 2050, and 2100, respectively:
Data sources Scenario data are taken from Clarke et al. (2007)[1] The graph is based on the "IGSM_REF" reference and "IGSM_Level1" mitigation scenarios. Data from Clarke et al. (2007)[1] are in the public-domain, and are included in a following section. The report by Clarke et al. (2007)[2] includes a graph similar to this one.
References
|
| Dato | |
| Kilde |
Eget arbejde Grafik blev lavet med LibreOffice Calc.
. |
| Forfatter | Enescot |
| Andre versioner | Greyscale version |
.png)
Comma-separated values
Data were exported from OpenOffice.org 4.0.0 Calc as comma separated values (csv). The following options were used:
- Character set: Western Europe 1252
- Field delimiter: ,
- Text delimiter: "
- Quote all text cells: no
- Save cell content as shown: yes
- Fixed column width: no
,2000,2020,2040,2060,2080,2100
Coal w/CCS,0,1.8726625295,75.444508718,129.1418011217,161.2538170578,173.6080558426
Coal w/o CCS,98.8551419634,52.5763595296,14.7533997718,10.6949287477,7.8754730012,5.8328272264
Commercial Biomass,0,20.6083814814,99.0391793264,176.0803406657,210.4123076545,232.6318594815
Natural Gas w/CCS,0,1.5101981599,17.1928804846,41.4536597029,51.1393522238,51.5289485318
Natural Gas w/o CCS,81.7896749777,105.2241810432,94.7490924601,55.8540853312,36.0936516819,24.8688375282
Non-Biomass Renewables,22.4833651954,25.7664179053,25.7110203361,29.253511178,36.4853378946,44.045134245
Nuclear,25.5985811645,19.5501420401,16.2462719057,16.8718264901,18.7264128277,20.4973853194
Oil,158.145950192,178.1305902789,146.8464751178,114.2820116004,115.9689587686,113.0792083141
Energy reduction,-0.000000048,181.9869034265,330.6765460279,454.2481828487,561.2932891661,677.6003453143
Licensering
| Denne fil er udgivet under Creative Commons CC0 1.0 Universal Public Domain Dedication. | |
| Personen, der har tilknyttet et værk til dette dokument, har dikteret værket som offentlig ejendom ved at give afkald alle hans eller hendes rettigheder til værket på verdensplan efter lov om ophavsret og alle relaterede og beslægtede rettigheder, i det omfang lovgivningen tillader det. Du kan kopiere, distribuere og forarbejde værket selv til kommercielle formål; alt sammen uden at spørge om godkendelse.
|
Filhistorik
Klik på en dato/tid for at se filen som den så ud på det tidspunkt.
| Dato/tid | Miniaturebillede | Dimensioner | Bruger | Kommentar | |
|---|---|---|---|---|---|
| nuværende | 3. nov. 2013, 10:10 | | 1.508 × 850 (71 KB) | Enescot | {{Information |Description ={{en|1=This graph shows a projection of global primary electricity consumption (PEC) by source, over the 21st century. It is based on a [[:en:climate change mitigation|climate change mitiga... |
Filanvendelse
Den følgende side bruger denne fil:
Global filanvendelse
Følgende andre wikier anvender denne fil:
- Anvendelser på cs.wikipedia.org