Fil:RiemannCriticalLine.svg

Size of this PNG preview of this SVG file: 800 × 372 pixels. Andre opløsninger: 320 × 149 pixels | 640 × 298 pixels | 1.024 × 476 pixels | 1.280 × 595 pixels | 2.560 × 1.191 pixels | 933 × 434 pixels.
Fuld opløsning (SVG fil, basisstørrelse 933 × 434 pixels, filstørrelse: 50 KB)
|
|
Denne fil er fra Wikimedia Commons. Beskrivelsen af filen fra Commons er gengivet nedenfor. |
W3C-validity not checked.
Beskrivelse
| Beskrivelse |
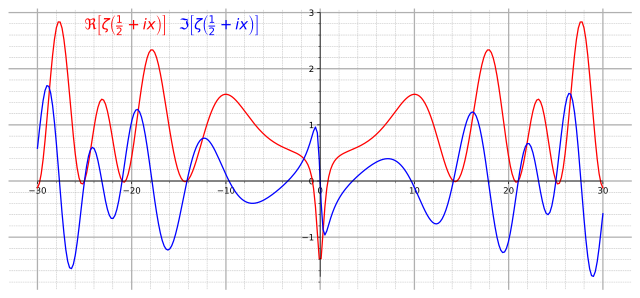
English: Graph of real (red) and imaginary (blue) parts of the critical line Re(z)=1/2 of the Riemann zeta function. |
||
| Dato | |||
| Kilde |
Own work. Made with Mathematica using the following code: Show[Plot[{Re[Zeta[1/2+I x]], Im[Zeta[1/2+I x]]}, {x,-30, 30},AxesLabel->{"x"} , PlotStyle->{Red, Blue}, Ticks->{Table[4x-28,{x,0,14}]}, ImageSize->{800,600}],
Graphics[Text[Style[\[DoubleStruckCapitalR][\[Zeta][ I x + "1/2"]],14,Red ,Background ->White],{-22,2.6} ]],
Graphics[Text[Style[\[GothicCapitalI][\[Zeta][ I x + "1/2"]],14,Blue ,Background ->White],{-14,2.6} ]]] |
||
| Forfatter | Slonzor | ||
| Tilladelse (Genbrug af denne fil) |
Public Domain | ||
| SVG udvikling | |||
| Kildekode | Python code
|
Licensering
| Jeg, indehaveren af ophavsretten til dette værk, udgiver dette værk som offentlig ejendom. Dette gælder i hele verden. I nogle lande er dette ikke juridisk muligt. I så fald: Jeg giver enhver ret til at anvende dette værk til ethvert formål, uden nogen restriktioner, medmindre sådanne restriktioner er påkrævede ved lov. |
Filhistorik
Klik på en dato/tid for at se filen som den så ud på det tidspunkt.
| Dato/tid | Miniaturebillede | Dimensioner | Bruger | Kommentar | |
|---|---|---|---|---|---|
| nuværende | 23. aug. 2017, 22:01 | | 933 × 434 (50 KB) | Krishnavedala | much reduced vector version |
| 25. sep. 2009, 00:28 |  | 800 × 600 (122 KB) | Geek3 | linewidth=1px | |
| 20. nov. 2008, 21:33 |  | 800 × 600 (122 KB) | Slonzor | Man i've messed this up a lot of times. | |
| 20. nov. 2008, 21:27 |  | 800 × 600 (3,36 MB) | Slonzor | ||
| 20. nov. 2008, 21:23 |  | 800 × 600 (3,36 MB) | Slonzor | ||
| 20. nov. 2008, 21:18 |  | 800 × 600 (3,36 MB) | Slonzor | ||
| 20. nov. 2008, 21:13 |  | 800 × 600 (79 KB) | Slonzor | {{Information |Description={{en|1=Graph of real (red) and imaginary (blue) parts of the critical line Re(z)=1/2 of the Riemann zeta function.}} |Source=Own work. Made with Mathematica using the following code: <code><nowiki>Show[Plot[{Re[Zeta[1/2+I x]], |
Filanvendelse
De følgende 2 sider bruger denne fil:
Global filanvendelse
Følgende andre wikier anvender denne fil:
- Anvendelser på ar.wikipedia.org
- Anvendelser på ba.wikipedia.org
- Anvendelser på be.wikipedia.org
- Anvendelser på ca.wikipedia.org
- Anvendelser på ckb.wikipedia.org
- Anvendelser på el.wikipedia.org
- Anvendelser på en.wikipedia.org
- Anvendelser på eo.wikipedia.org
- Anvendelser på eu.wikipedia.org
- Anvendelser på fa.wikipedia.org
- Anvendelser på fi.wikipedia.org
- Anvendelser på he.wikipedia.org
- Anvendelser på hi.wikipedia.org
- Anvendelser på hy.wikipedia.org
- Anvendelser på id.wikipedia.org
- Anvendelser på it.wikipedia.org
- Anvendelser på it.wikiquote.org
- Anvendelser på ja.wikipedia.org
- Anvendelser på ko.wikipedia.org
- Anvendelser på la.wikipedia.org
- Anvendelser på mn.wikipedia.org
- Anvendelser på nn.wikipedia.org
- Anvendelser på no.wikipedia.org
- Anvendelser på pa.wikipedia.org
- Anvendelser på pt.wikipedia.org
- Anvendelser på ru.wikipedia.org
- Anvendelser på sl.wikipedia.org
- Anvendelser på sq.wikipedia.org
- Anvendelser på sr.wikipedia.org
- Anvendelser på uk.wikipedia.org
- Anvendelser på vi.wikipedia.org
- Anvendelser på zh-yue.wikipedia.org
- Anvendelser på zh.wikipedia.org