Fil:Extremum Testing.svg

Size of this PNG preview of this SVG file: 650 × 325 pixels. Andre opløsninger: 320 × 160 pixels | 640 × 320 pixels | 1.024 × 512 pixels | 1.280 × 640 pixels | 2.560 × 1.280 pixels.
Fuld opløsning (SVG fil, basisstørrelse 650 × 325 pixels, filstørrelse: 75 KB)
|
|
Denne fil er fra Wikimedia Commons. Beskrivelsen af filen fra Commons er gengivet nedenfor. |
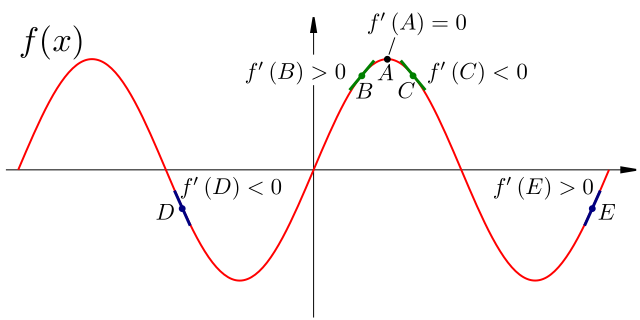
| Beskrivelse | A diagram showing how to classify an extremum according to gradients of nearby points. The green points and gradients show good points to sample. The blue points nad graidents show bad points to sample, as they were taken on the far side of other extrema and give the wrong answer. | ||
| Dato | |||
| Kilde |
self-made Vektorgrafikken blev lavet med Inkscape.
. |
||
| Forfatter | Inductiveload | ||
| Tilladelse (Genbrug af denne fil) |
|
Filhistorik
Klik på en dato/tid for at se filen som den så ud på det tidspunkt.
| Dato/tid | Miniaturebillede | Dimensioner | Bruger | Kommentar | |
|---|---|---|---|---|---|
| nuværende | 23. okt. 2007, 22:45 | | 650 × 325 (75 KB) | Inductiveload | added gradient lables for all points |
| 23. okt. 2007, 22:33 |  | 650 × 325 (55 KB) | Inductiveload | add point labels | |
| 23. okt. 2007, 22:21 |  | 650 × 325 (43 KB) | Inductiveload | {{Information |Description=A diagram showing how to classify an extremum according to gradients of nearby points. The green points and gradients show good points to sample. The blue points nad graidents show bad points to sample, as they were taken on the |
Filanvendelse
Den følgende side bruger denne fil:
Global filanvendelse
Følgende andre wikier anvender denne fil:
- Anvendelser på en.wikibooks.org