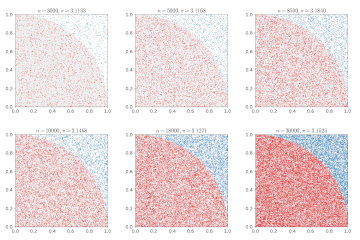
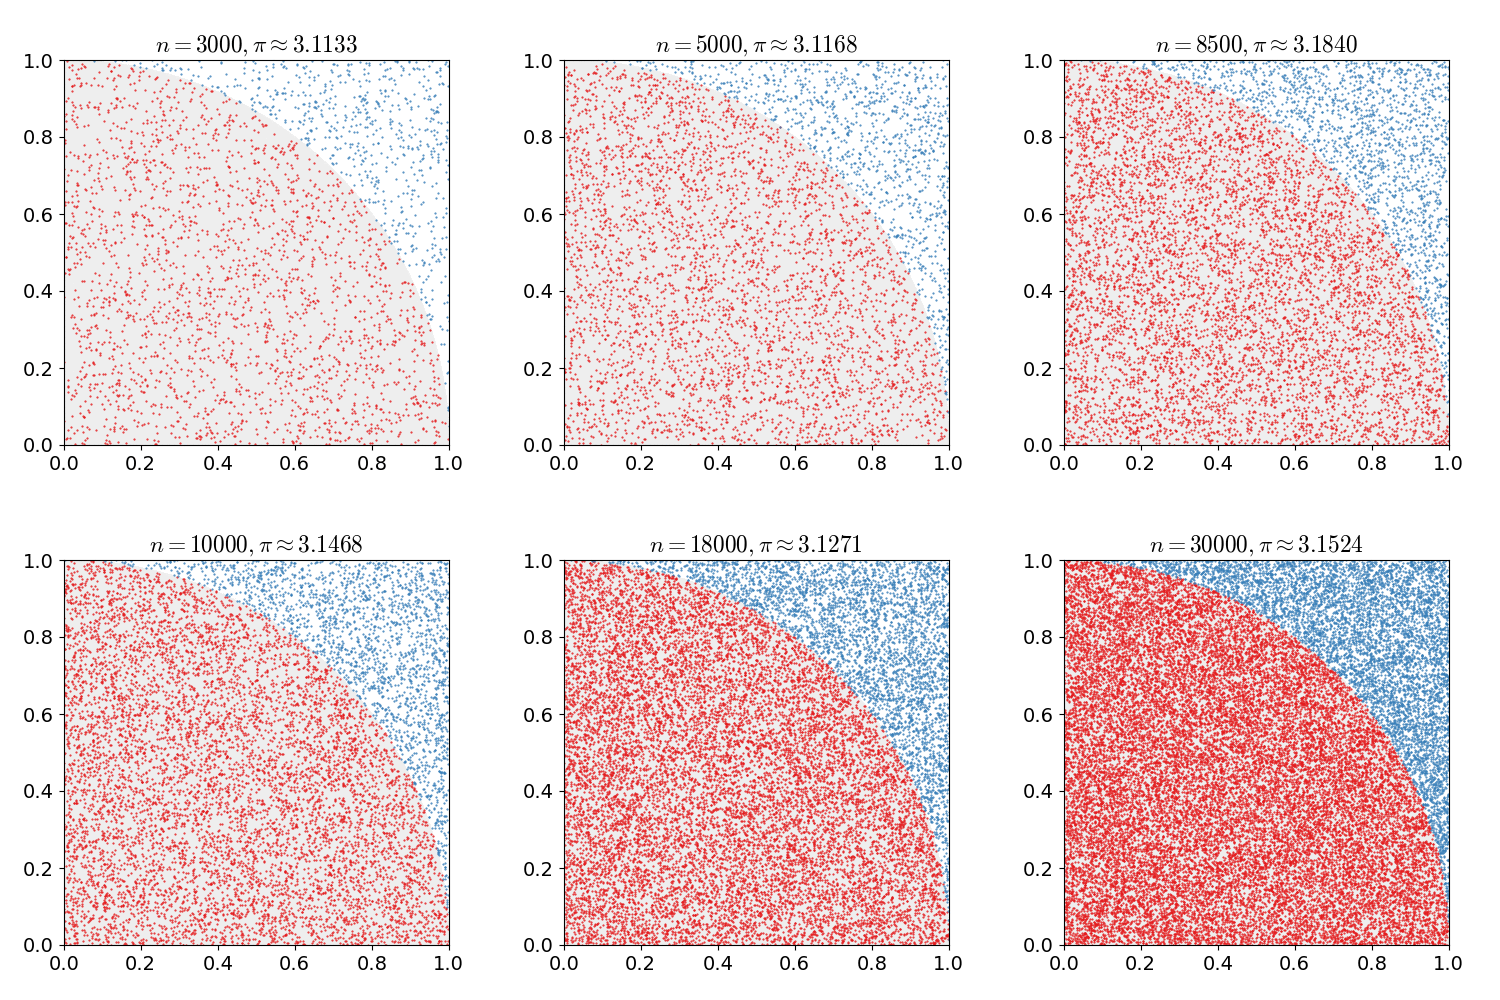
Fil:Pi 30K.gif
Pi_30K.gif (500 × 500 billedpunkter, filstørrelse: 476 KB, MIME-type: image/gif, gentaget, 10 rammer, 2,0 s)
Filhistorik
Klik på en dato/tid for at se filen som den så ud på det tidspunkt.
| Dato/tid | Miniaturebillede | Dimensioner | Bruger | Kommentar | |
|---|---|---|---|---|---|
| nuværende | 16. feb. 2017, 18:00 |  | 500 × 500 (476 KB) | Nicoguaro | Make the plot square and increase gif delay. |
| 16. feb. 2017, 17:38 |  | 640 × 480 (476 KB) | Nicoguaro | Bigger text in the axes, and colors from ColorBrewer. Code in Python. | |
| 7. nov. 2011, 20:29 |  | 500 × 500 (373 KB) | Rayhem | Slowed animation to avoid looking like a blinky page element, improved resolution, added counter for number of points, shaded points inside/outside the circle. ==Mathematica 7.0 Source== <pre> tinyColor[color_, point_] := {PointSize[Small], color, Point[ | |
| 15. mar. 2011, 01:12 |  | 360 × 369 (363 KB) | CaitlinJo | {{Information |Description ={{en|1=As points are randomly scattered inside the unit square, some fall within the unit circle. The fraction of points inside the circle over all points approaches pi as the number of points goes toward infinity. This ani |
Filanvendelse
Den følgende side bruger denne fil:
Global filanvendelse
Følgende andre wikier anvender denne fil:
- Anvendelser på ar.wikipedia.org
- Anvendelser på be.wikipedia.org
- Anvendelser på bg.wikipedia.org
- Anvendelser på ca.wikipedia.org
- Anvendelser på el.wikipedia.org
- Anvendelser på en.wikipedia.org
- Anvendelser på en.wikibooks.org
- Anvendelser på eo.wikipedia.org
- Anvendelser på eu.wikipedia.org
- Anvendelser på fa.wikipedia.org
- Anvendelser på fr.wikipedia.org
- Anvendelser på he.wikipedia.org
- Anvendelser på hi.wikipedia.org
- Anvendelser på id.wikipedia.org
- Anvendelser på it.wikipedia.org
- Anvendelser på ja.wikipedia.org
- Anvendelser på ko.wikipedia.org
- Anvendelser på pt.wikipedia.org
- Anvendelser på sh.wikipedia.org
- Anvendelser på simple.wikipedia.org
- Anvendelser på sl.wikipedia.org
- Anvendelser på sr.wikipedia.org
- Anvendelser på sv.wikipedia.org
- Anvendelser på ta.wikipedia.org
- Anvendelser på test.wikipedia.org
- Anvendelser på tr.wikipedia.org
- Anvendelser på uk.wikipedia.org
- Anvendelser på vi.wikipedia.org
- Anvendelser på www.wikidata.org
- Anvendelser på zh-yue.wikipedia.org
- Anvendelser på zh.wikipedia.org
