Tautochrone_curve.gif(300 × 200 billedpunkter, filstørrelse: 102 KB, MIME-type: image/gif, gentaget, 80 rammer, 3,2 s)


Denne fil er fra Wikimedia Commons

Beskrivelse

Beskrivelse

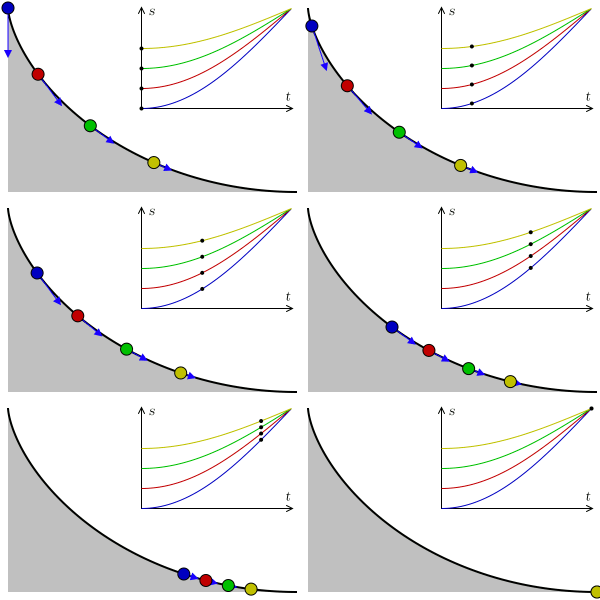
A tautochrone curve is the curve for which the time taken by an object sliding without friction in uniform gravity to its lowest point is independent of its starting point. Here, four points at different positions reach the bottom at the same time.


In the graphic, s represents arc length, t represents time, and the blue arrows represent acceleration along the trajectory. As the points reach the horizontal, the velocity becomes constant, the arc length being linear to time.
Dato 9. maj 2007; new version august 2009
Kilde Eget arbejde
Forfatter

Claudio Rocchini

rewritten by Geek3
GIF udvikling
InfoField
 
GIF Rastergrafik blev lavet med Matplotlib.
Kildekode
InfoField

Python code

#!/usr/bin/python
# -*- coding: utf8 -*-

'''
animation of balls on a tautochrone curve
'''

import os
import numpy as np
import matplotlib.pyplot as plt
import matplotlib.patches as patches
from matplotlib import animation
from math import *

# settings
fname = 'Tautochrone curve'
width, height = 300, 200
nframes = 80
fps=25

balls = [
{'a':1.0, 'color':'#0000c0'},
{'a':0.8, 'color':'#c00000'},
{'a':0.6, 'color':'#00c000'},
{'a':0.4, 'color':'#c0c000'}]

def curve(phi):
    x = phi + sin(phi)
    y = 1.0 - cos(phi)
    return np.array([x, y])

def animate(nframe, empty=False):
    t = nframe / float(nframes - 1.)
    
    # prepare a clean and image-filling canvas for each frame
    fig = plt.gcf()
    fig.clf()
    ax_canvas = plt.gca()
    ax_canvas.set_position((0, 0, 1, 1))
    ax_canvas.set_xlim(0, width)
    ax_canvas.set_ylim(0, height)
    ax_canvas.axis('off')
    
    # draw the ramp
    x0, y0 = 293, 8
    h = 182
    npoints = 200
    points = []
    for i in range(npoints):
        phi = i / (npoints - 1.0) * pi - pi
        x, y = h/2. * curve(phi) + np.array([x0, y0])
        points.append([x, y])
    
    rampline = patches.Polygon(points, closed=False, facecolor='none',
                       edgecolor='black', linewidth=1.5, capstyle='butt')
    points += [[x0-h*pi/2, y0], [x0-h*pi/2, y0+h]]
    
    ramp = patches.Polygon(points, closed=True, facecolor='#c0c0c0', edgecolor='none')
    
    # plot axes
    plotw = 0.5
    ax_plot = fig.add_axes((0.47, 0.46, plotw, plotw*2/pi*width/height))
    ax_plot.set_xlim(0, 1)
    ax_plot.set_ylim(0, 1)
    for b in balls:
        time_array = np.linspace(0, 1, 201)
        phi_pendulum_array = (1 - b['a'] * np.cos(time_array*pi/2))
        ax_plot.plot(time_array, phi_pendulum_array, '-', color=b['color'], lw=.8)
    ax_plot.set_xticks([])
    ax_plot.set_yticks([])
    ax_plot.set_xlabel('t')
    ax_plot.set_ylabel('s')
    
    ax_canvas.add_patch(ramp)
    ax_canvas.add_patch(rampline)
    
    for b in balls:
        # draw the balls
        phi_pendulum = b['a'] * -cos(t * pi/2)
        phi_wheel = 2 * asin(phi_pendulum)
        phi_wheel = -abs(phi_wheel)
        x, y = h/2. * curve(phi_wheel) + np.array([x0, y0])
        ax_canvas.add_patch(patches.Circle((x, y), radius=6., zorder=3,
                            facecolor=b['color'], edgecolor='black'))
        ax_plot.plot([t], [1 + phi_pendulum], '.', ms=6., mec='none', mfc='black')
        
        v = h/2. * np.array([1 + cos(phi_wheel), sin(phi_wheel)])
        vnorm = v / hypot(v[0], v[1])
        # in the harmonic motion, acceleration is proportional to -position
        acc_along_line = 38. * -phi_pendulum * vnorm
        ax_canvas.arrow(x, y, acc_along_line[0], acc_along_line[1],
                 head_width=6, head_length=6, fc='#1b00ff', ec='#1b00ff')

fig = plt.figure(figsize=(width/100., height/100.))
print 'saving', fname + '.gif'
#anim = animation.FuncAnimation(fig, animate, frames=nframes)
#anim.save(fname + '.gif', writer='imagemagick', fps=fps)

frames = []
for nframe in range(nframes):
    frame = fname + '_{:02}.png'.format(nframe)
    animation.FuncAnimation(fig, lambda n: animate(nframe), frames=1).save(
        frame, writer='imagemagick')
    frames.append(frame)

# assemble animation using imagemagick, this avoids dithering and huge filesize
os.system('convert -delay {} +dither +remap -layers Optimize {} "{}"'.format(
    100//fps, ' '.join(['"' + f + '"' for f in frames]), fname + '.gif'))
for frame in frames:
    if os.path.exists(frame):
        os.remove(frame)

Licensering

Jeg, dette værks ophavsretsindehaver, udgiver hermed værket under den følgende licens:
GNU head Tilladelse er givet til at kopiere, distribuere og/eller ændre dette dokument under betingelserne i GNU Free Documentation License', Version 1.2 eller enhver senere version udgivet af Free Software Foundation; uden et invariant afsnit, ingen forsidetekster, og ingen bagsidetekst. En kopi af licensen er inkluderet i afsnittet GNU Free Documentation License.
w:da:Creative Commons
kreditering deling på samme vilkår
Denne fil er udgivet under Creative Commons Kreditering-Del på samme vilkår 3.0 Ikke-porteret-licensen.
Du må frit:
  • at dele – at kopiere, distribuere og overføre værket
  • at remixe – at tilpasse værket
Under følgende vilkår:
  • kreditering – Du skal give passende kreditering, angive et link til licensen, og oplyse om der er foretaget ændringer. Du må gøre det på enhver fornuftig måde, men ikke på en måde der antyder at licensgiveren godkender dig eller din anvendelse.
  • deling på samme vilkår – Hvis du bearbejder, ændrer eller bygger videre på dette værk, skal du distribuere dine bidrag under den samme eller en kompatibel licens som originalen.
Denne licens blev tilføjet som en del af GFDL-licensopdateringen.
w:da:Creative Commons
kreditering
Denne fil er udgivet under Creative Commons Navngivelse 2.5 Generisk-licensen
Du må frit:
  • at dele – at kopiere, distribuere og overføre værket
  • at remixe – at tilpasse værket
Under følgende vilkår:
  • kreditering – Du skal give passende kreditering, angive et link til licensen, og oplyse om der er foretaget ændringer. Du må gøre det på enhver fornuftig måde, men ikke på en måde der antyder at licensgiveren godkender dig eller din anvendelse.
Du kan vælge den licens du foretrækker.

Captions

Tilføj en kort forklaring på en enkelt linje om hvad filen viser

Elementer som er med i denne fil

afbilder

image/gif

Filhistorik

Klik på en dato/tid for at se filen som den så ud på det tidspunkt.

Dato/tidMiniaturebilledeDimensionerBrugerKommentar
nuværende1. aug. 2009, 15:15Miniature af versionen fra 1. aug. 2009, 15:15300 × 200 (102 KB)Geek3new physically correct version
9. maj 2007, 08:56Miniature af versionen fra 9. maj 2007, 08:56300 × 200 (602 KB)Rocchini{{Information |Description=Tautochrone curve animation (4 points runs over a cycloid) |Source=Own work |Date=2007-05-09 |Author=Claudio Rocchini |Permission=CC-BY 2.5 }}

Den følgende side bruger denne fil:

Global filanvendelse

Følgende andre wikier anvender denne fil: