Fil:Window function (rectangular).png
Størrelse af denne forhåndsvisning: 800 × 359 pixels. Andre opløsninger: 320 × 144 pixels | 640 × 287 pixels | 1.024 × 460 pixels | 1.280 × 575 pixels | 2.500 × 1.123 pixels.
Fuld opløsning (2.500 × 1.123 billedpunkter, filstørrelse: 83 KB, MIME-type: image/png)
|
|
Denne fil er fra Wikimedia Commons. Beskrivelsen af filen fra Commons er gengivet nedenfor. |
Transferred from en.wikipedia to Commons by Tiaguito.
Beskrivelse
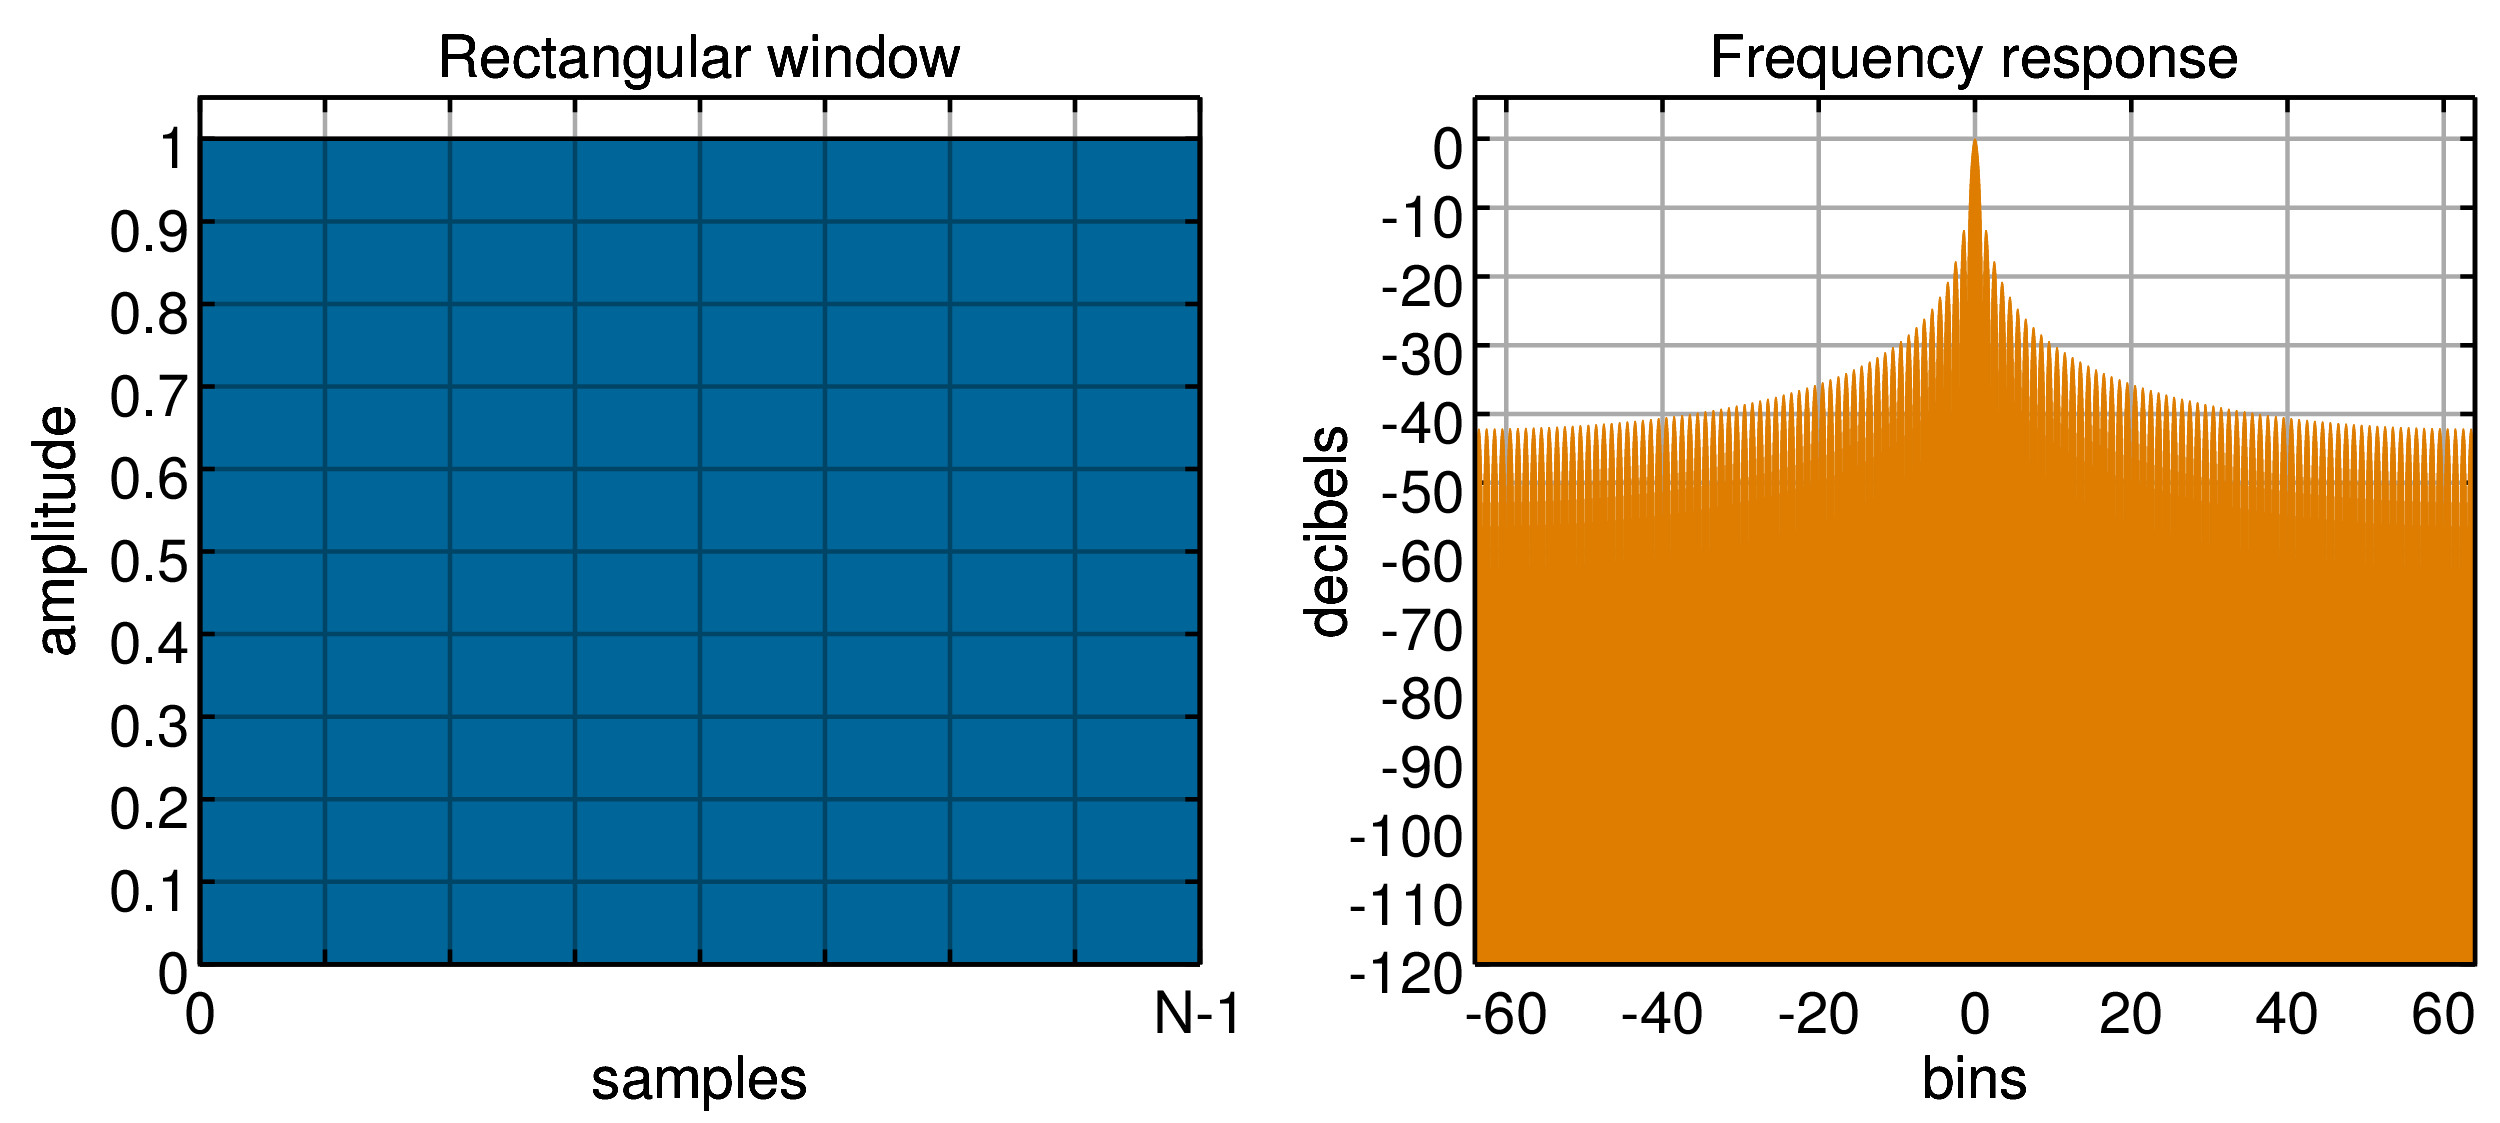
| Beskrivelse | rectangular window and frequency response | |||
| Dato | ||||
| Kilde | Eget arbejde | |||
| Forfatter | Bob K (original version), Olli Niemitalo | |||
| Tilladelse (Genbrug af denne fil) |
|
|||
| Andre versioner |
|
|||
| Source code | The script below generates these .png images:
This script has not been tested in MATLAB. See the individual file histories for the simpler MATLAB scripts that were the basis of this script. Generation of svg files by minor modification of the script displayed visual artifacts and renderer incompatibilities that could not be easily fixed. The current script fixes the visual artifacts in the png file as a post-processing step. The script generates a semi-transparent grid by taking a weighted average of two images, one with the grid and one without.Matlabfunction plotWindowLayer (w, N, gridded, wname, wspecifier)
M=32;
k=0:N-1;
dr = 120;
H = abs(fft([w zeros(1,(M-1)*N)]));
H = fftshift(H);
H = H/max(H);
H = 20*log10(H);
H = max(-dr,H);
figure('Position',[1 1 1200 520])
subplot(1,2,1)
set(gca,'FontSize',28)
area(k,w,'FaceColor', [0 1 1],'edgecolor', [1 1 0],'linewidth', 2)
xlim([0 N-1])
if (min(w) >= -0.01)
ylim([0 1.05])
set(gca,'YTick', [0 : 0.1 : 1])
ylabel('amplitude','position',[-16 0.525 0])
else
ylim([-1 5])
set(gca,'YTick', [-1 : 1 : 5])
ylabel('amplitude','position',[-16 2 0])
endif
set(gca,'XTick', [0 : 1/8 : 1]*(N-1))
set(gca,'XTickLabel',[' 0'; ' '; ' '; ' '; ' '; ' '; ' '; ' '; 'N-1'])
grid(gridded)
set(gca,'LineWidth',2)
set(gca,'gridlinestyle','-')
xlabel('samples')
if (strcmp (wspecifier, ""))
title(cstrcat(wname,' window'))
else
title(cstrcat(wname,' window (', wspecifier, ')'))
endif
set(gca,'Position',[0.08 0.11 0.4 0.8])
set(gca,'XColor',[1 0 1])
set(gca,'YColor',[1 0 1])
subplot(1,2,2)
set(gca,'FontSize',28)
h = stem(([1:M*N]-1-M*N/2)/M,H,'-');
set(h,'BaseValue',-dr)
ylim([-dr 6])
set(gca,'YTick', [0 : -10 : -dr])
set(findobj('Type','line'),'Marker','none','Color',[0 1 1])
xlim([-M*N/2 M*N/2]/M)
grid(gridded)
set(findobj('Type','gridline'),'Color',[.871 .49 0])
set(gca,'LineWidth',2)
set(gca,'gridlinestyle','-')
ylabel('decibels')
xlabel('bins')
title('Frequency response')
set(gca,'Position',[0.59 0.11 0.4 0.8])
set(gca,'XColor',[1 0 1])
set(gca,'YColor',[1 0 1])
endfunction
function plotWindow (w, wname, wspecifier = "", wfilespecifier = "")
if (strcmp (wfilespecifier, ""))
wfilespecifier = wspecifier;
endif
N = size(w)(2);
B = N*sum(w.^2)/sum(w)^2 % noise bandwidth (bins), set N = 4096 to get an accurate estimate
plotWindowLayer(w, N, "on", wname, wspecifier); % "gridded" = "on"
print temp1.png -dpng "-S2500,1165"
close
plotWindowLayer(w, N, "off", wname, wspecifier); % "gridded" = "off"
print temp2.png -dpng "-S2500,1165"
close
% I'm not sure what's going on here, but it looks like the author might have been able
% to save himself some time by using set(gca,"Layer","top") and set(gca,"Layer","bottom").
I = imread ("temp1.png");
J = imread ("temp2.png");
info = imfinfo ("temp1.png");
w = info.Width;
c = 1-(double(I(:,1:w/2,1))+2*double(J(:,1:w/2,1)))/(255*3);
m = 1-(double(I(:,1:w/2,2))+2*double(J(:,1:w/2,2)))/(255*3);
y = 1-(double(I(:,1:w/2,3))+2*double(J(:,1:w/2,3)))/(255*3);
c = ((c != m) | (c != y)).*(c > 0).*(1-m-y);
I(:,1:w/2,1) = 255*(1-c-m-y + 0*m + 0*y + 0*c);
I(:,1:w/2,2) = 255*(1-c-m-y + 0*m + 0*y + 0.4*c);
I(:,1:w/2,3) = 255*(1-c-m-y + 0*m + 0*y + 0.6*c);
c = 1-(double(I(:,w/2+1:w,1))+2*double(J(:,w/2+1:w,1)))/(255*3);
m = 1-(double(I(:,w/2+1:w,2))+2*double(J(:,w/2+1:w,2)))/(255*3);
y = 1-(double(I(:,w/2+1:w,3))+2*double(J(:,w/2+1:w,3)))/(255*3);
c = ((c != m) | (c != y)).*c;
I(:,w/2+1:w,1) = 255*(1-c-m-y + 0*m + 0*y + 0.8710*c);
I(:,w/2+1:w,2) = 255*(1-c-m-y + 0*m + 0*y + 0.49*c);
I(:,w/2+1:w,3) = 255*(1-c-m-y + 0*m + 0*y + 0*c);
if (strcmp (wfilespecifier, ""))
imwrite (I, cstrcat('Window function and frequency response - ', wname, '.png'));
else
imwrite (I, cstrcat('Window function and frequency response - ', wname, ' (', wfilespecifier, ').png'));
endif
endfunction
N=128;
k=0:N-1;
w = 0.42 - 0.5*cos(2*pi*k/(N-1)) + 0.08*cos(4*pi*k/(N-1));
plotWindow(w, "Blackman")
w = 0.355768 - 0.487396*cos(2*pi*k/(N-1)) + 0.144232*cos(4*pi*k/(N-1)) -0.012604*cos(6*pi*k/(N-1));
plotWindow(w, "Nuttall", "continuous first derivative")
w = 1 - 1.93*cos(2*pi*k/(N-1)) + 1.29*cos(4*pi*k/(N-1)) -0.388*cos(6*pi*k/(N-1)) +0.032*cos(8*pi*k/(N-1));
plotWindow(w, "Flat top")
w = 1 - 1.93*cos(2*pi*k/(N-1)) + 1.29*cos(4*pi*k/(N-1)) -0.388*cos(6*pi*k/(N-1)) +0.028*cos(8*pi*k/(N-1));
plotWindow(w, "SRS flat top")
w = ones(1,N);
plotWindow(w, "Rectangular")
w = (N/2 - abs([0:N-1]-(N-1)/2))/(N/2);
plotWindow(w, "Triangular")
w = 0.5 - 0.5*cos(2*pi*k/(N-1));
plotWindow(w, "Hann")
w = 0.53836 - 0.46164*cos(2*pi*k/(N-1));
plotWindow(w, "Hamming", "alpha = 0.53836")
alpha = 0.5;
w = ones(1,N);
n = -(N-1)/2 : -alpha*N/2;
L = length(n);
w(1:L) = 0.5*(1+cos(pi*(abs(n)-alpha*N/2)/((1-alpha)*N/2)));
w(N : -1 : N-L+1) = w(1:L);
plotWindow(w, "Tukey", "alpha = 0.5")
w = sin(pi*k/(N-1));
plotWindow(w, "Cosine")
w = sinc(2*k/(N-1)-1);
plotWindow(w, "Lanczos")
w = ((N-1)/2 - abs([0:N-1]-(N-1)/2))/((N-1)/2);
plotWindow(w, "Bartlett")
sigma = 0.4;
w = exp(-0.5*( (k-(N-1)/2)/(sigma*(N-1)/2) ).^2);
plotWindow(w, "Gaussian", "sigma = 0.4")
w = 0.62 -0.48*abs(k/(N-1) -0.5) +0.38*cos(2*pi*(k/(N-1) -0.5));
plotWindow(w, "Bartlett–Hann")
alpha = 2;
w = besseli(0,pi*alpha*sqrt(1-(2*k/(N-1) -1).^2))/besseli(0,pi*alpha);
plotWindow(w, "Kaiser", "alpha = 2")
alpha = 3;
w = besseli(0,pi*alpha*sqrt(1-(2*k/(N-1) -1).^2))/besseli(0,pi*alpha);
plotWindow(w, "Kaiser", "alpha = 3")
tau = N-1;
epsilon = 0.1;
t_cut = tau * (0.5 - epsilon);
T_in = abs(k - 0.5 * tau);
z_exp = ((t_cut - 0.5 * tau) ./ (T_in - t_cut) + (t_cut - 0.5 * tau) ./ (T_in - 0.5 * tau));
sigma = (T_in < 0.5 * tau) ./ (exp(z_exp) + 1);
w = 1 * (T_in <= t_cut) + sigma .* (T_in > t_cut);
plotWindow(w, "Planck-taper", "epsilon = 0.1")
w = 0.35875 - 0.48829*cos(2*pi*k/(N-1)) + 0.14128*cos(4*pi*k/(N-1)) -0.01168*cos(6*pi*k/(N-1));
plotWindow(w, "Blackman-Harris")
w = 0.3635819 - 0.4891775*cos(2*pi*k/(N-1)) + 0.1365995*cos(4*pi*k/(N-1)) -0.0106411*cos(6*pi*k/(N-1));
plotWindow(w, "Blackman-Nuttall")
w = 1 - 1.93*cos(2*pi*k/(N-1)) + 1.29*cos(4*pi*k/(N-1)) -0.388*cos(6*pi*k/(N-1)) +0.032*cos(8*pi*k/(N-1));
plotWindow(w, "Flat top")
tau = (N/2);
w = exp(-abs(k-(N-1)/2)/tau);
plotWindow(w, "Exponential", "tau = N/2", "half window decay")
tau = (N/2)/(60/8.69);
w = exp(-abs(k-(N-1)/2)/tau);
plotWindow(w, "Exponential", "tau = (N/2)/(60/8.69)", "60dB decay")
alpha = 2;
w = 1/2*(1 - cos(2*pi*k/(N-1))).*exp(alpha*abs(N-2*k-1)/(1-N));
plotWindow(w, "Hann-Poisson", "alpha = 2")
| |||
| Kildekode | Octave
|


.png?uselang=da)
.png)
.png)
.png)
.png)
.png)
.png)
.png)
.png)
.png)
.png)
.png)
.png)
.png)
.png)
.png)
.png)
.png)
.png)
.png)
.png)
Filhistorik
Klik på en dato/tid for at se filen som den så ud på det tidspunkt.
| Dato/tid | Miniaturebillede | Dimensioner | Bruger | Kommentar | |
|---|---|---|---|---|---|
| nuværende | 9. feb. 2013, 18:48 | | 2.500 × 1.123 (83 KB) | Olli Niemitalo | Antialiasing, layout changes, larger font |
| 17. dec. 2005, 23:07 | 1.038 × 419 (7 KB) | Tiaguito~commonswiki | file size. color source: http://en.wikipedia.org/wiki/Window_Function | ||
| 17. dec. 2005, 22:48 | 1.038 × 419 (8 KB) | Tiaguito~commonswiki | source: http://en.wikipedia.org/wiki/Window_Function author: http://en.wikipedia.org/wiki/User:Bob_K |
Filanvendelse
Den følgende side bruger denne fil:
Global filanvendelse
Følgende andre wikier anvender denne fil:
- Anvendelser på et.wikipedia.org
.png)